![]() ----------- Your trusted
source for independent sensor data- Photons to Photos------------ Last revised:
2021-06-10 13:00 GMT-5
----------- Your trusted
source for independent sensor data- Photons to Photos------------ Last revised:
2021-06-10 13:00 GMT-5
Previous Article----------------------------------- Table of Contents------------------------------------ Next Article
---------------------- Optics Primer - Rectilinear Projection Lenses
--------------------------------------------------------- By Bill Claff
As covered in the previous
article, we know that the perfect Rectilinear lens has a projection described
by the formula (y / f) =
tan( Θ ).
But we also know that no such perfection exists. So, how do we determine
whether a lens is in fact Rectilinear?
Certainly by visual inspection
we look to see if lines are straight. If they curve out too much (barrel
distortion) or in too much (pincushion distortion) we are unhappy.
If the bulging is pronounced we would probably declare that the lens is a
fisheye rather than Rectilinear.
Determining what type of fisheye is the subject of a later article.
We can also measure distortion to determine how non-linear our lines are. Such tests are well known and standardized.
This article will examine how Rectilinear lenses fit into a unified classification system introduced as two families of curves in the previous article.
Distortion is observed and measured
in comparison to some undistorted reference.
Probably because of how our vision works we have assigned the Rectilinear
projection as the undistorted standard.
This is probably also why the vast majority of photographic lenses are
Rectilinear; because we want to capture the world as we see it.
Because our lenses are cylindrical projection distortions are radial.
The standard test results for
Rectilinear distortion are expressed as a percentage deviation from linear.
But it's important to realize that this arise from a radial displacement not a
linear one.
Instead of using grids we could use test images of evenly spaces concentric
circles are report of the deviation of the photographed circles from their
expected positions.
In the unified system the Rectilinear
projection belongs to the family k
* tan ( Θ / k) where k
= 1 is a perfect Rectilinear lens..
What if k differs from
1? Values less than 1 cause pincushion distortion and those above 1 cause
barrel distortion.
Let's define radial distortion
as (k * tan ( Θ / k)) / tan
( Θ ) - 1.
The numerator is actual radial displacement while the denominator is expected
perfect placement. Naturally, when k
= 1 this value is 0.
So, if we can determine k for a lens and use the half-angle of view for Θ then we can compute a value for maximum radial distortion.
I did this for a set of over 400
lenses using optical prescriptions from patents and ray tracing information
from the Optical Bench.
The optical prescriptions were evaluated at infinity focus and for zoom lenses
the widest angle of view was used.
Here is a scatter chart of the
results compared against 159 lenses of those lenses for which I found linear
distortion information:
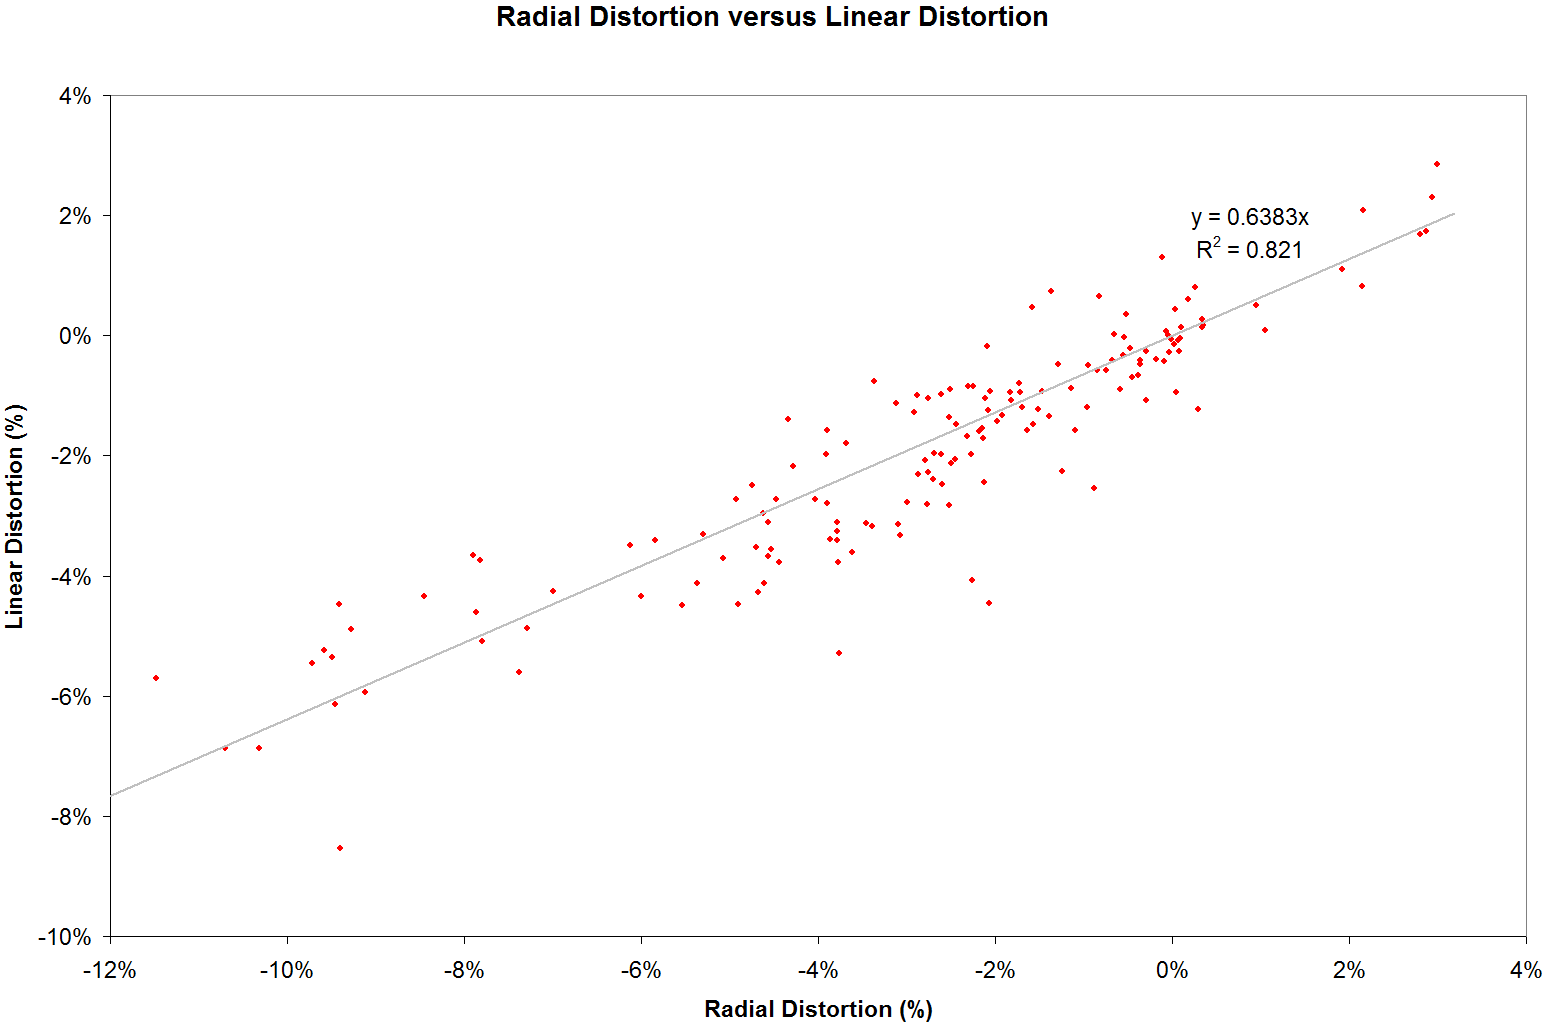
Considering the very disparate techniques this correlation is quite good.
One obvious feature is that
although the trend line passes through 0,0 the slope is not 1.
Radial distortion values are about 1.5 times higher than linear distortion
values; but, there is a good reason for
this.
Linear distortion measurements normalize the center to corner radius.
In other words, linear distortion assumes that the corners are correct and
measures the displacement of the side to the corners.
On the other hand, radial distortion is measuring whether the corners are in
the right place.
So with perfect measurements we would expect radial distortion to always be
greater than linear distortion because of this normalization process.
As we can see far more
rectilinear lenses exhibit barrel distortion (negative values) than pincushion
(positive values).
And barrel distortion is also stronger than pincushion.
As a rough characterization let's say that rectilinear lenses have linear distortion ranging from -8% to 2% which is -12% to 3% radial distortion.
Let's place the test data along
with lines indicating the -12% and 3% radial distortion on the Projection
Formulas chart.
Each black dot is the endpoint of the curve for the projection formula for the
lens as fit to the k * tan (
Θ / k) family:
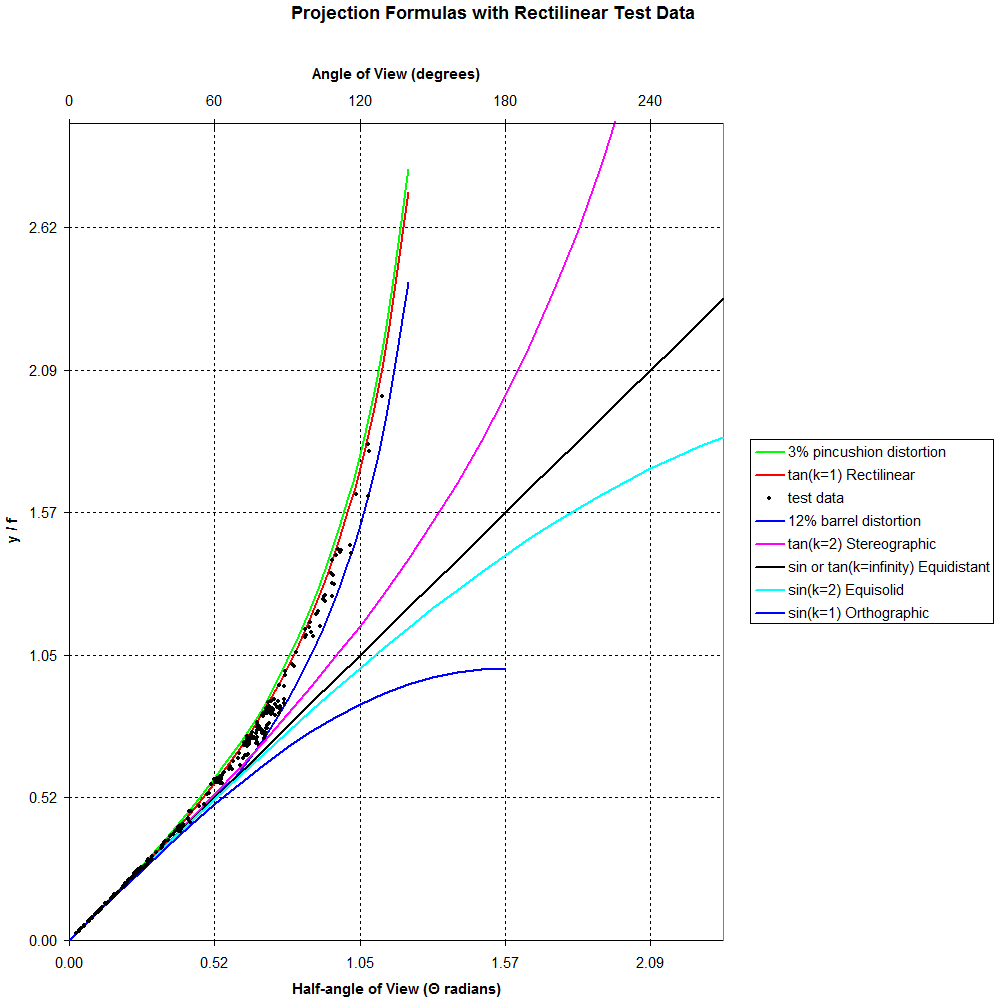
And, for clarity, a closer look:
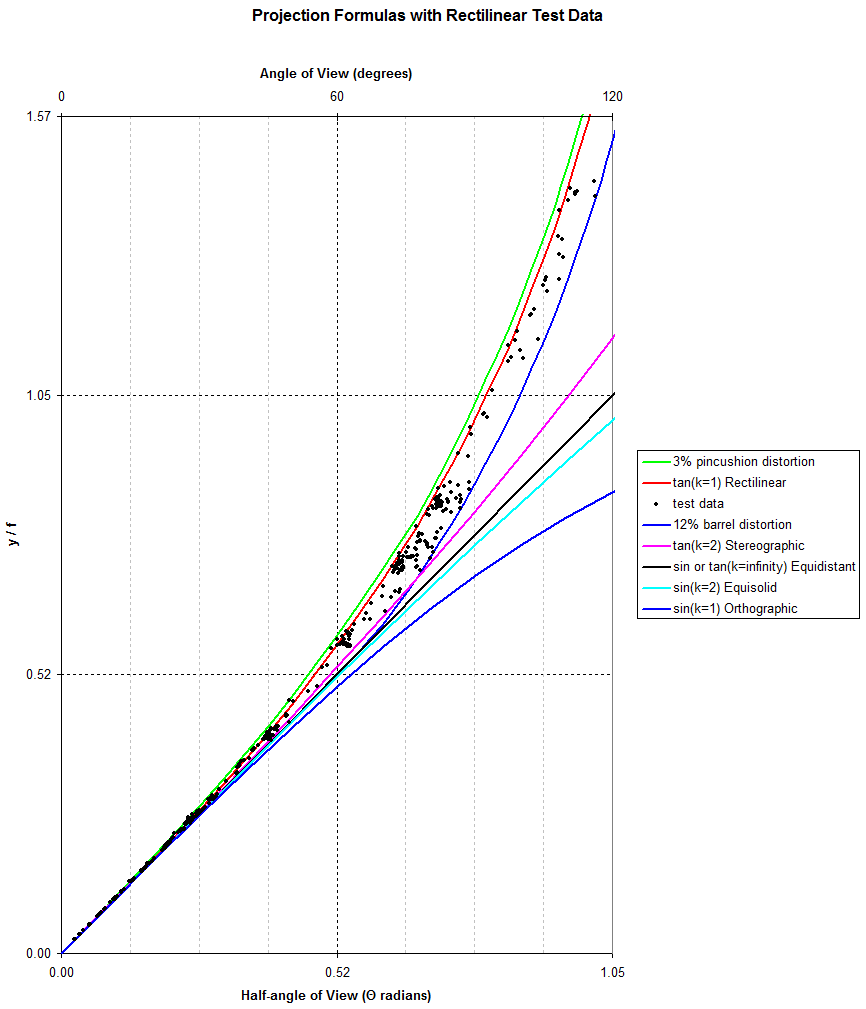
So, the rectlinear lenses lie between the green and blue curves, although
perhaps not so close to the perfect red curve as we might have expected.
If we have the optical
prescription for an unknown lens we can determine Θ and k.
And if the datapoint lies between the green and blue curves we could safely
assume that the projection is Rectilinear.
Outside of this region, how
would we classify a lens as Stereographic, Equidistant, Equisolid, or
Orthographic?
That is a subject for a follow-up article.
Previous Article----------------------------------- Table of Contents------------------------------------ Next Article