![]() ----------- Your trusted
source for independent sensor data- Photons to Photos------------------------ Last revised:
2015-03-07
----------- Your trusted
source for independent sensor data- Photons to Photos------------------------ Last revised:
2015-03-07
Previous Article----------------------------------- Table of Contents------------------------------------ Next Article
---------------- Sensor Analysis Primer - Fixed Pattern Noise Analysis
--------------------------------------------------------- By Bill Claff
Many sensor characteristics are computed for the entire
image without regard for spatial qualities.
Consider the following two images with identical averages and standard
deviations:
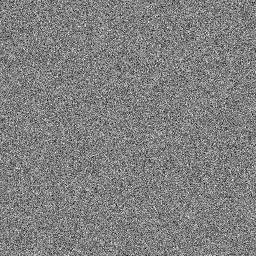
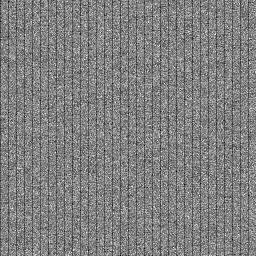
Clearly the fine grained random distribution in the left-hand image is
preferable to the vertical banding in the right-hand image.
Fixed Pattern Noise (FPN), as the name implies, is noise
that is in a fixed position spatially.
Examples of noise that are not components of FPN include read noise and Poisson
noise.
There are two primary components of FPN, Dark Signal
Non-Uniformity (DSNU), and Photo Response Non-Uniformity (PRNU).
DSNU is a variation in the offset of the pixel value when
there is no illumination (black frames).
PRNU is a variation in how the pixel responds to light (illuminated frames).
We assume that a pixel responds in a linear fashion to illumination.
Algebraically:
response = offset + illumination * slope
So DSNU is the variation of offset and PRNU is the variation of slope.
DSNU and PRNU are computed over the entire frame; and the
two images above have identical DSNU and PRNU.
So in investigating FPN we not only want to measure DSNU and PRNU but also to
somehow characterize their spatial nature.
That is the real challenge.
Stacking
In analyzing FPN I stack the raw data of evenly illuminated
frames. (Black frames are evenly non-illuminated.)
During stacking pixels are stored as floating point values and as an average of
the previous frames as opposed to a sum.
Each time a frame is added the random noise of the
accumulated stack is reduced.
Algebraically:
Notice that no matter how high the ![]() gets,
gets, ![]() cannot be eliminated.
cannot be eliminated.
If we square the above equation we get:
Given ![]() and
and ![]() for several frames we can perform a fit and compute
for several frames we can perform a fit and compute ![]() and
and ![]() .
.
I have found that stack 16 frames is sufficient to get very good values.
This chart shows visually how such a fit looks:
For black frames the ![]() is DSNU and for
illuminated frames the
is DSNU and for
illuminated frames the ![]() is PRNU.
is PRNU.
Reporting DSNU and PRNU
PRNU is typically reported as a
percentage of illumination (signal).
Normally for the technology in current consumer digital cameras PRNU runs about
0.5%
I have chosen to report DSNU in
both Digital Number (DN) and as a percentage of read noise which generally runs
approximately 10%.
Note that a side-effect of
computing DSNU is that we also get a read noise value.
I compare this read noise value against other sources as a sanity check.
Similarly, computing PRNU allows
an estimation of Full Well Capacity (FWC) and conversions gain.
These values are also checked against other sources.
Conclusion
In this article I demonstrated
how we can determine DSNU and PRNU by using the flat field technique and an
equation fit.
One advantage of this technique
is that we can examine the resulting stacked image for patterns rather than
relying on a single number to characterize FPN.
Visualization and further analysis of FPN will be the subject of a follow up article.