Verifying X3 Planes
Prepared 2014-04-20 by Bill Claff (revised 2014-04-21)
To verify my assignment of the top, middle, and bottom
planes of an X3 sensor in an X3F file I acquired three images.
The three images were taken with a Sigma SD9 of a primary red, green, and blue
target respectively.
Jpegs
The SD9 doesn't do out of the
camera Jpegs so I ran the X3F files through Sigma Photo Pro (SPP) with default
settings:
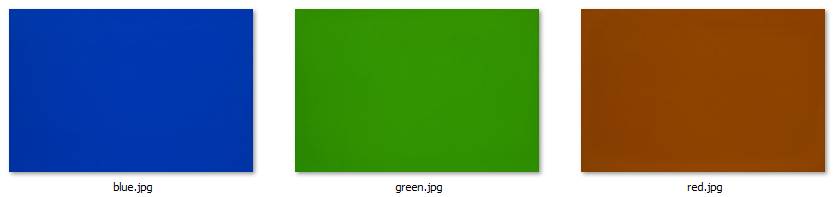
I'd say the red image is closer to brown, but I wasn't really surprised by this
Raw Histograms
The histograms for the three images are as follows:
Note that these are scatter charts not histograms and that
the charts are not to the same scale.
An important feature is that the dominant color for each plane is as expected,
blue, green, and red for the top, middle, and bottom planes.
Color Determination
I was also curious to see if I could determine the colors of the computer screen used to generate the image,
The peak signals for each color were determined and converted to CIE x and CIE y.
|
Image |
Peak R |
Peak G |
Peak B |
CIE x |
CIE y |
|
Red |
1254 |
788 |
441 |
0.505 |
0.317 |
|
Green |
584 |
830 |
667 |
0.281 |
0.399 |
|
Blue |
105 |
510 |
1046 |
0.063 |
0.307 |
It was very satisfying to see the results:

On this chart the colored diamonds indicate the computed values.
The approximate values of 628nm, 550nm, and 468nm are quite reasonable values
as the dominant frequency for computer monitor LCDs.
The fact that the values are also 90-95% saturated fits well too.